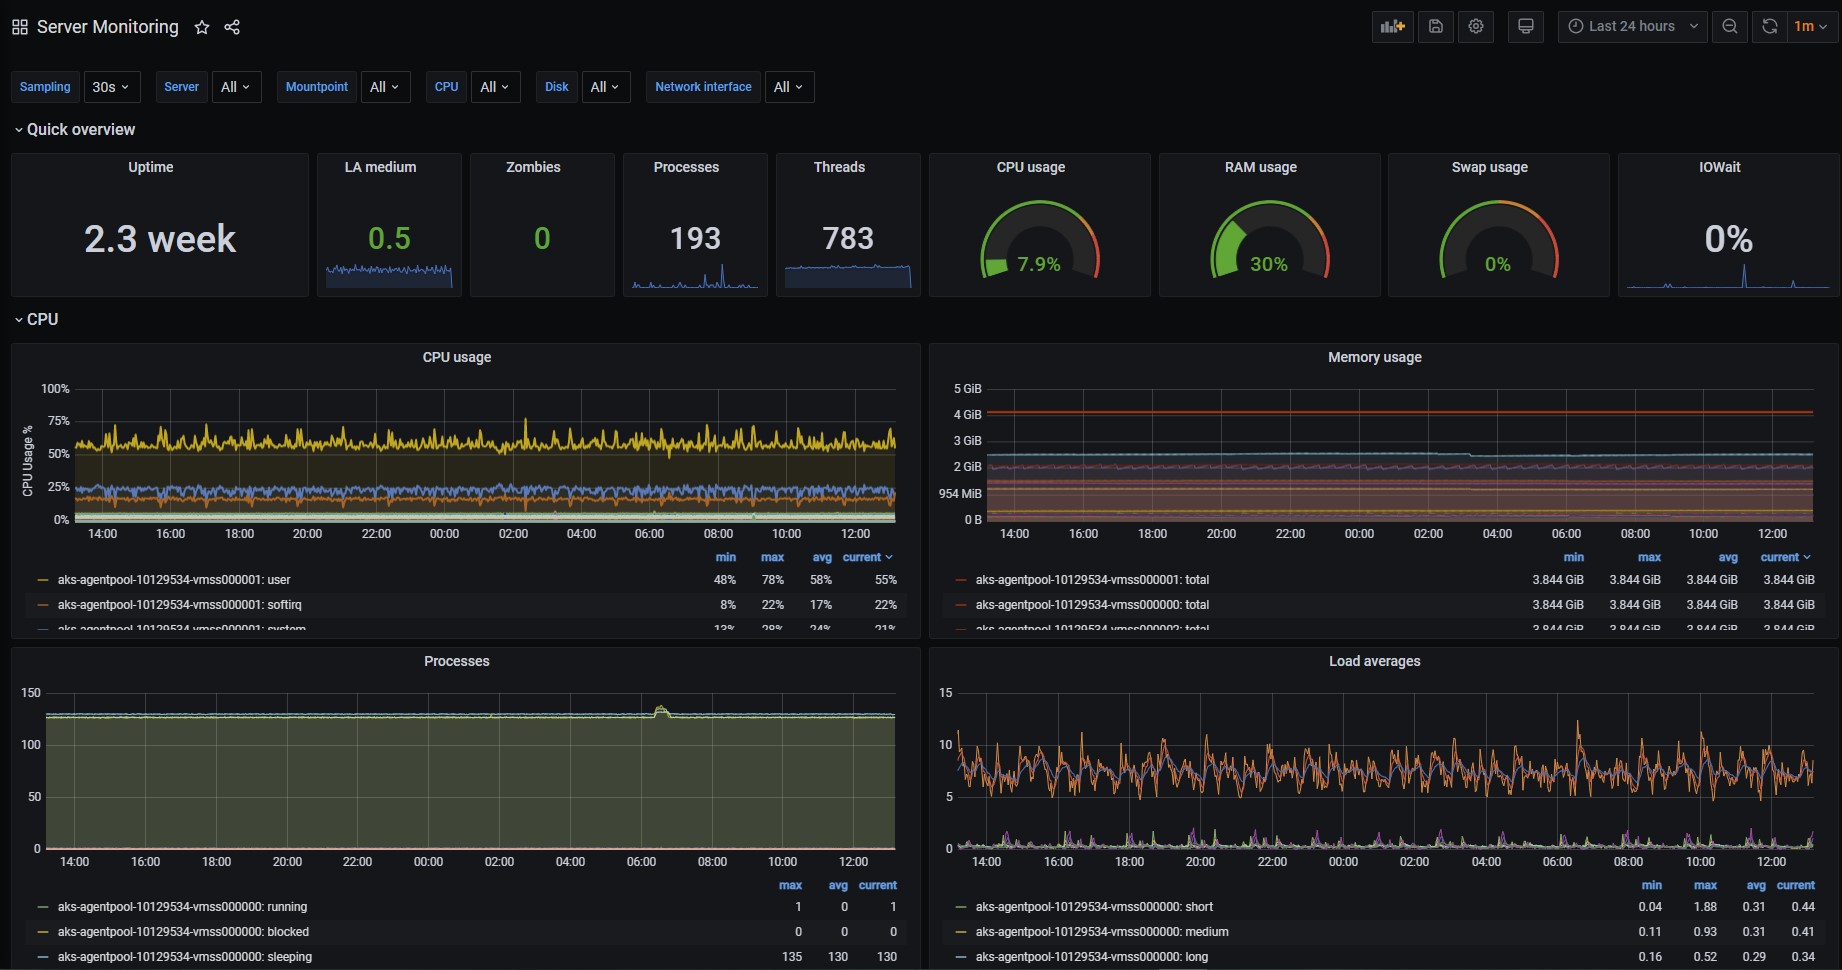
Here at Fort Digital, we’re excited to share some details of our new partnership with Grafana Labs. Grafana Labs is a multi-platform analytics and visualisation web application: good-looking graphs, charts and alerts created from various different data sources and sets.
It’s open source, something we highly-value at Fort Digital. Grafana enables its end-users to query, visualise and understand metrics no matter where they are stored or how many data sources they have. In fact, there are a number of reasons why we chose to partner with Grafana.
So what led us to this platform? And where will we be going next with Grafana Labs?

Using data to tell a story
Every organisation has data. Each will have different types of data, from different data sets, and different data sources. But whatever the data, there’s one golden truth: the most powerful thing you can do with your data is to get it to tell a story. And in most organisations, that also means helping multiple stakeholders understand why that data – and story – is important.
This is done in many ways. Some use spreadsheets, some use PowerPoint presentations, some might use dashboard technology. But it’s often inconsistent – even within the same teams, let alone across services. We wanted to change that.
An integral part of what we do at Fort Digital is visualisation – transforming data to insights – and our visualisations are one of the things that set us apart in the software analytics world. Part of how the insights are realised is through smooth and comprehensive visualisations. It’s important that we always offer our clients consistent reporting and visualisation, whether that’s through the life-cycle of an application, displaying real-time information on a service or simply for an organisation’s executives to understand at regular cadence what is happening within any element of the service they’re responsible for delivering. Visualisations that are slick, familiar, and comprehensive. It’s imperative that we have the right visualisation technology to bring the data alive and help us explain complex problems to a wide range of stakeholders.
We needed to find a technology that was powerful, enabled us to absorb many datasets for visualisation, and looked the part. Introducing: Grafana.
Powerful and slick: the best of both worlds
There’s a saying: you can put lipstick on a pig, but it’s still a pig. In the data world, some dashboard technologies look great, but underneath, they aren’t all that powerful. The Grafana dashboarding tool, on the other hand, has the lipstick and everything else. It’s a powerful, performant technology, constantly evolving new ways to visualise data, while always keeping it slick and modern.
The slick UI means it doesn’t just look good, but it’s a really easy tool to use and build dashboards from – and there are many different ways you can use it. The challenging part is adding context: that’s where Fort Digital comes in.
Flexibility and the ability to integrate
In the before-times, we’d often use existing point toolsets to help us with our visualisations. So if we were trying to highlight a network problem, we’d utilise the user interface available within that given technology. But that significantly restricted us in only being able to use the data available on each of those tools. If we compiled a PowerPoint, and put a diagram together, it was still a point-in-time visualisation – not a real-time picture that people could access from any device, any time. We wanted to move away from using tooling and monitoring systems, to an application that gave us the flexibility to absorb multiple data sources and tell the whole story around a service – in real-time.
One of the reasons Grafana is powerful is its ability to integrate with a range of different systems. First, it doesn’t tie you to a single data source. You can query your data from as many places as you want. And if you need to pull data in from a platform that isn’t supported by Grafana, it’s open source and is extensible through plugins, so you can build your own interface – or more often that not, someone will have already built one that you can use! The Grafana plugins make our lives much easier at Fort Digital as we no longer have to write our own integrations but can simply select a plugin, say for Datadog or ServiceNow. Having that custom, pre-built integration to seamlessly interact with third party systems saves organisations, and us, a lot of time.
Grafana’s easy integration with many other enterprise IT systems enables us to be more fluid in how we interact with other critical systems in any given environment. And it enables us to be flexible with the data we aggregate and how we visualise it.
Getting techy: some of our favourite features
While Grafana is the core offering from Grafana Labs, there are a significant number of other tools and features available – some of which we’ve already started using at Fort Digital.
A new feature of Grafana we’ve been getting our teeth stuck into is Transformations. The Transformations feature allows you to manipulate your data, but without having to do it at source. In doing this, it gives you that extra layer of control over the data you want to present. You can do a range of calculations across fields that would be technically difficult to do in your source data; you can do groupings; renames of datasets; you can merge multiple datasets into one across time. It’s a powerful and growing technology – and we’re very excited about its potential.
Another tool we’ve started using is Loki: a powerful log aggregation tool. Every IT organisation has hundreds or thousands of log files sat on servers that contain really useful information but only get looked at when something goes wrong. When that problem does arise, you have to go to the server, find the log file (hoping that it’s still there) and then manually read through them to find what you need. And these files are often thousands of lines long. Loki enables you to put all of these log files into one place and – crucially – draw metrics from them. Once it’s in one place, it’s easy to go and find a log file when you need it. But you can also actually graph the data in those log files. So if you have an access log that tells you how long it takes pages to load, you can pull that data out and visualise it in a dashboard. It means you can weaponise those log files, and actually use them for something proactive, rather than just when problems arise.
Grafana Labs have another very new platform we’re using: Tempo – for distributed tracing. This enables you to build in observability from day one. If you have implemented distributed tracing, when you load a web page, you will get instantaneous metrics about how long it took, which bits were fast, which bits were slow – all sent to a centralised analytics system. That means you can understand how your platform works on each end user device, rather than just how it works centrally. It’s a very powerful tool. (Stay tuned for a future blog where we go into this in more detail…!)
Looking ahead: the future of the partnership
At Fort Digital, we’re stoked about our partnership with Grafana, and all that the future holds in working together.
Grafana’s technology is continually evolving and getting more and more badass. We cherish that entrepreneurial mindset at Fort Digital: constantly progressing, re-developing, implementing new features. We’re excited to be part of the journey as tools and technologies expand. There are countless projects on the go, many new platforms emerging – and it’s all open source. That means you can use whatever version of the product that suits your needs. There’s no pressure to update or upgrade. Many organisations are starting to use Grafana, and with the knowledge and expertise that comes from our partnership, we can help clients at every level get the most out of their initial deployments.
Their community network is also evolving. We’re proud to be part of their growing global partner network, and the strides they are making in utilising, upskilling and embracing that network.


